Thursday, July 15, 2021

EUR/GBP: Volume Profile and Price Action Analysis


Hello guys,

yesterday’s market analysis turned into a beautiful trade so I hope you took it! If you missed it, then here it is:

EUR/CHF: Volume Profile and Price Action Analysis

Today, I will also do a day trading analysis. This time on the EUR/GBP.

There is a newly formed uptrend (BTW starting from Swing Long level from our Elite Pack members area) which I think could provide a nice trading opportunity!

This new uptrend started from a rotation that formed yesterday.

Volume Profile Analysis

I used my Flexible Volume Profile to look into the rotation to see how volumes were distributed there.

As you can see from the picture below, there was quite a huge chunk of volumes accumulated in this rotation.

I think that strong institutional Buyers were building up their Long positions there.

Those BIG guys need to build up their positions in a rotation since that’s the only place where they can place their massive trades without being spotted and without moving the price too much.

Why do I think it was Buyers? Because of the the new uptrend that followed the rotation.

EUR/GBP; 30 Minute chart:

Strong Institutional Buyers

Knowing there were strong institutional Buyers entering their Longs in the rotation, how do we work with this information?

Since we know the Buyers placed a lot of their trading positions in this zone starting at 0.8518, we can assume that this zone is important for them.

When the price makes a pullback into this zone again, those BIG guys will want to defend it.

Defend how? By manipulating the price upwards again – using aggressive Market Orders.

This is what should help to push the price upwards from there and what makes the zone (starting at 0.8518) a strong Support.

The Volume Profile setup I used here is called the “Volume Accumulation Setup“.

I hope you guys liked my analysis! Let me know what you think in the comments below!

Happy trading,

-Dale

Tuesday, July 13, 2021

AUD/CHF: Swing Trading Analysis With Volume Profile And Price Action


Hello guys,

today’s post is going to be a Swing trade analysis. This means we will be looking at higher time frames – in this case, Daily time frame.

The pair I want to have a look at is the AUD/CHF.

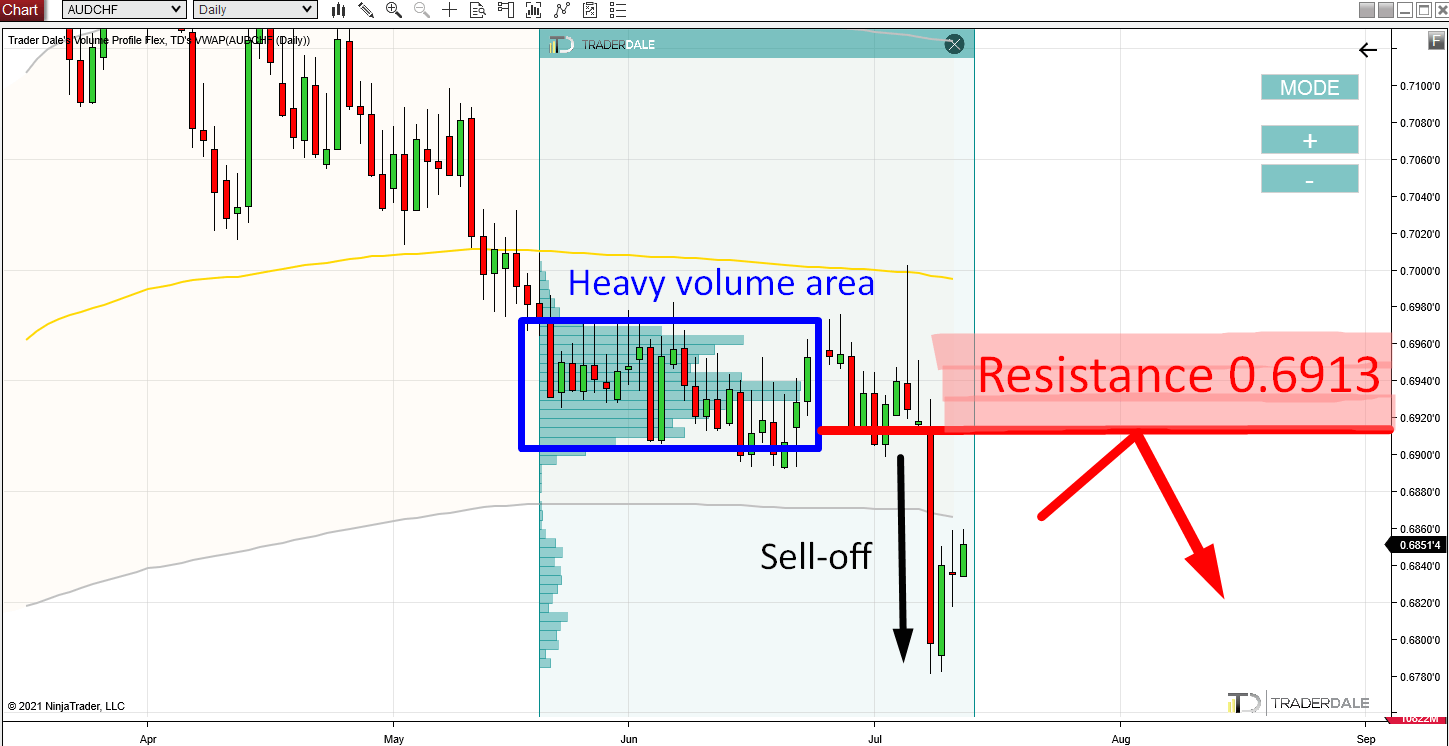
Last week, there was a really strong sell-off on the AUD/CHF. The massive bearish Daily candle that formed on Thursday made over 100 pips in just one day. Such a huge daily range is not too common for the AUD/CHF!

What does such a strong sell-off mean? It means strong institutional Sellers!

Those Sellers were slowly accumulating their Short positions in the rotation that lasted the whole month of June.

You can see their heavy volumes in the June rotation by using my Flexible Volume Profile indicator.

AUD/CHF, Daily chart:

When the price makes it back into this heavy volume zone again, then the strong institutional Sellers are likely to defend it and push the price downwards again.

This zone is important for them, because they placed a lot of their Short positions there.

For this reason, the heavy volume zone (starting at 0.6913) should work as a Resistance. We just need to wait for a pullback…

This Volume Profile setup is called the “Volume Accumulation Setup“. It’s one of my most favorite trading setups!

I hope you guys liked my analysis! Let me know what you think in the comments below!

Happy trading,

-Dale
Tuesday, July 6, 2021

NZD/USD: Day Trading Analysis With Volume Profile


Do you want ME to help YOU with your trading?

Join one of my Volume Profile Educational courses and get my private trading levels, 15 hours of video content, my custom made Volume Profile indicators, and more!

I hope you guys liked my analysis!

Let me know what Forex pairs or other trading instruments you want in the next one! Let me know in the comments below or in the comments below this video on YouTube.

Happy trading,

-Dale

Thursday, July 1, 2021

AUD/CAD: Volume Profile And Price Action Swing Trading Analysis


Hello guys,

today, we will have a look at a swing trading analysis on AUD/CAD.

For swing trading analysis I like to use 4-hour charts or Daily charts. Today, I will do the whole thing on the Daily chart as it is really nicely visible and easy to understand there.

So, why have I picked AUD/CAD? Because there is a nice and strong trend. If you have been following me for some time then you know that I like to look for significant volumes that were traded inside such trends.

I look for those using my Flexible Volume Profile.

Volume Profile Setup

In this case, I used my Flexible Volume Profile to look into the downtrend area. It revealed a strong Volume Cluster.

Such Volume Cluster represents a place where strong Sellers were adding to their Short positions – it reveals their big, institutional volumes.

When the price makes it back to this Volume Cluster area (starting at 0.9473) then those strong institutional traders should defend it. They will defend it because they placed a lot of their Shorts there before (this place is important for them).

This is why this zone should work as a strong Resistance.

This setup is called “Volume Profile: Trend Setup“

AUD/CAD; Daily chart:

Do you want ME to help YOU with your trading?

Join one of my Volume Profile Educational courses and get my private trading levels, 15 hours of video content, my custom made Volume Profile indicators, and more!

Price Action Setup

Another reason this 0.9473 zone should work as a Resistance is that it worked as a strong Support in the past.

How can I tell? Because the price bounced off this zone twice, and always very strongly.

When this Support got breached it became a Resistance. This is my favorite Price Action setup that I like to use as a combo with my Volume Profile setups.

You can learn more about this setup here:

Price Action Setup: Support → Resistance

AUD/CAD; Daily chart:

What I like about this is that those two setups (Volume Profile and Price Action setups) nicely align and both point to the same Resistance area around 0.9473.

I hope you guys liked my analysis! Let me know what you think in the comments below!

Happy trading,

-Dale

Wednesday, June 30, 2021

AUD/JPY: Volume Profile, VWAP, and Price Action Analysis


Hello guys,

in today’s day trading analysis I would like to show you a nice-looking Resistance that has just formed on AUD/JPY.

On Monday and Tuesday, there was a downtrend. When there is a trend I am always interested in how volumes were distributed there. What I look for are significant volume areas (= volume clusters) that are inside the trend.

Those Volume Clusters represent places where big trading institutions were active and where they were adding to their trading positions.

What I did here, was that I used my Flexible Volume Profile indicator, and stretched it over the whole trend area.

This revealed a significant Volume Cluster.

AUD/JPY; 30 Minute chart:

This Volume Cluster is now very important, because strong Sellers who were pushing the price downwards (into the downtrend) were adding massively to their Shorts there.

When the price makes it back (pullback) into this Volume Cluster area, then those Sellers will want to defend this zone. Why? Because they placed a lot of their Shorts there. This zone is important for them!

This is what will make this area (starting at 83.49) a strong day trading Resistance.

Do you want ME to help YOU with your trading?

Join one of my Volume Profile Educational courses and get my private trading levels, 15 hours of video content, my custom made Volume Profile indicators, and more!

VWAP Trend Setup

Another thing I wanted to point out on the AUD/JPY is how nicely it is reacting to my VWAP trading setups.

The screenshot below is the last 7 days on AUD/JPY (60 Minute chart). In this period, there were six trading opportunities which were based solely on my VWAP Trend Setup. 1 Loser, 5 Winners. Pretty cool, right? Given the fact how simple this setup is!

BTW. If you don’t know what I am talking about and what VWAP Trend Setup is, then you can learn it for example in this webinar recording:

VWAP Trading Setups (WEBINAR)

I hope you guys liked my analysis! Let me know what you think in the comments below!

Happy trading,

-Dale

Tuesday, June 29, 2021

CAD/CHF: Volume Profile and Price Action Analysis


Hello guys,

in yesterday’s Trading ideas video, I was showing you how to use Volume Profile when there is a trend. Today, I am going to continue with this topic and show you one more example.

This time it will be a current uptrend on CAD/CHF.

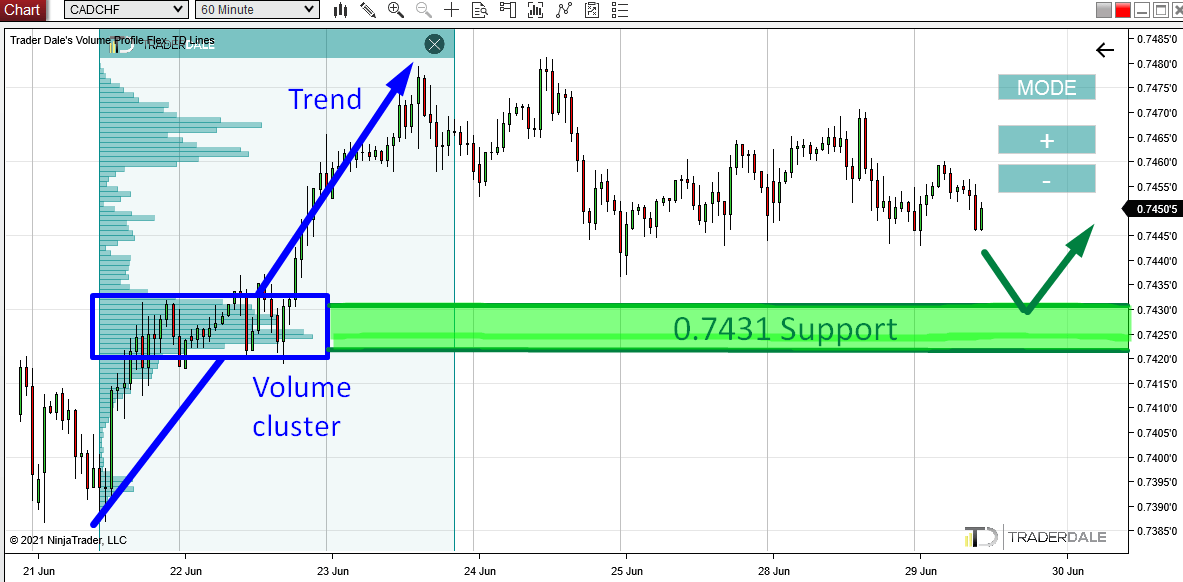
This uptrend started on 21st June and lasted until 23 June. 

What Happens In A Trend

What happens in an uptrend is that strong aggressive Buyers are pushing the price upwards. BUT they need to enter their Long positions somewhere! Big institutional traders can’t just open a trading position with one click of their mouse like you or me. They need time to enter their trades since they have way more trading capital than we do.

What they need is a little rotation inside the trend. In such a rotation, they are able to place their trading orders.

Since we are all about tracking the BIG guys, we want to identify where they placed their Longs there. The simplest way is to use my Flexible Volume Profile and stretch it over the whole trend area. Like in the picture below:

CAD/CHF; 60 Minute chart:

Volume Profile Analysis

As you can see from the picture above, there was an uptrend. Inside this uptrend there was a significant Volume Cluster.

This Volume Cluster shows us the area where the strong Buyers were adding massively to their Long trading positions.

Then they pushed the price upwards some more and the uptrend continued.

So what do we do? Now we know that there were strong Buyers in the heavy volume area starting at 0.7431. Those strong Buyers will want to defend this area. It is important for them because they placed a lot of their Longs there.

For this reason, when the price makes it back to the area (starting at 0.7431), those Buyers will try and push the price upwards from there again.

This is what will make it a strong Support.

This setup is called the “Volume Profile – Trend Setup“

I hope you guys liked my analysis! Let me know what you think in the comments below!

Happy trading,

-Dale